
NAME
r.futures.demand - Script for creating demand table which determines the quantity of land change expected.KEYWORDS
raster, demandSYNOPSIS
Flags:
- --overwrite
- Allow output files to overwrite existing files
- --help
- Print usage summary
- --verbose
- Verbose module output
- --quiet
- Quiet module output
- --ui
- Force launching GUI dialog
Parameters:
- development=name[,name,...] [required]
- Names of input binary raster maps representing development
- subregions=name [required]
- Raster map of subregions
- observed_population=name [required]
- CSV file with observed population in subregions at certain times
- projected_population=name [required]
- CSV file with projected population in subregions at certain times
- simulation_times=integer[,integer,...] [required]
- For which times demand is projected
- method=string[,string,...] [required]
- Relationship between developed cells (dependent) and population (explanatory)
- Options: linear, logarithmic, exponential, exp_approach, logarithmic2
- Default: linear,logarithmic
- linear: y = A + Bx
- logarithmic: y = A + Bln(x)
- exponential: y = Ae^(BX)
- exp_approach: y = (1 - e^(-A(x - B))) + C (SciPy)
- logarithmic2: y = A + B * ln(x - C) (SciPy)
- plot=name
- Save plotted relationship between developed cells and population into a file
- File type is given by extension (.pdf, .png, .svg)
- demand=name [required]
- Output CSV file with demand (times as rows, regions as columns)
- population_demand=name
- Output CSV file with projected population demand (times as rows, regions as columns)
- observed_development=name
- Output CSV file with observed development (times as rows, regions as columns)
- Useful for further processing and debugging
- resulting_curves=name
- Output CSV file with coefficients of fitted curves
- Useful for further processing and debugging
- separator=character
- Separator used in CSV files
- Special characters: pipe, comma, space, tab, newline
- Default: comma
Table of contents
DESCRIPTION
The r.futures.demand module of FUTURES determines the quantity of expected land changed. It creates a demand table as the number of cells to be converted at each time step for each subregion based on the relation between the population and developed land in the past years.The input accepts multiple (at least 2) rasters of developed (category 1) and undeveloped areas (category 0) from different years, ordered by time. For these years, user has to provide the population numbers for each subregion in parameter observed_population as a CSV file. The format is as follows. First column is time (matching the time of rasters used in parameter development) and first row is the category of the subregion. The separator can be set with parameter separator.
year,37037,37063,...
1985,19860,10980,...
1995,20760,12660,...
2005,21070,13090,...
2015,22000,13940,...
The same table is needed for projected population (parameter projected_population). The categories of the input raster subregions must match the identifiers of subregions in files given in observed_population and projected_population. Parameter simulation_times is a comma separated list of times for which the demand will be computed. The first time should be the time of the developed/undeveloped raster used in r.futures.simulation as a starting point for simulation. There is an easy way to create such list using Python:
','.join([str(i) for i in range(2015, 2031)])or Bash:
seq -s, 2015 2030
The format of the output demand table is:
year,37037,37063,37069,...
2012,1362,6677,513,...
2013,1856,4850,1589,...
2014,1791,5972,903,...
2015,1743,5497,1094,...
2016,1722,5388,1022,...
2017,1690,5285,1077,...
2018,1667,5183,1029,...
...
where each value represents the number of new developed cells in each step. It's a standard CSV file, so it can be opened in a text editor or a spreadsheet application if needed. The separator can be set with parameter separator. In case the demand values would be negative (in case of population decrease or if the relation is inversely proportional) the values are turned into zeros, since FUTURES does not simulate change from developed to undeveloped sites.
The method parameter allows to choose the type of relation between population and developed area. The available methods include linear, logarithmic (2 options), exponential and exponential approach relation. If more than one method is checked, the best relation is selected based on RMSE. Recommended methods are logarithmic, logarithmic2, linear and exp_approach. Methods exponential approach and logarithmic2 require scipy and at least 3 data points (raster maps of developed area).
An optional output plot is a plot of the relations for each subregion. It allows to more effectively assess the relation suitable for each subregion. The file format is determined from the extension and can be for example PNG, PDF, SVG.
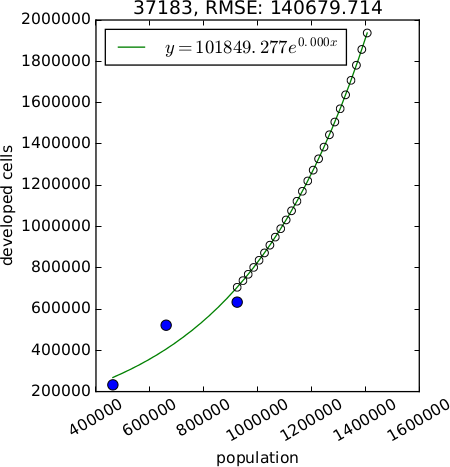
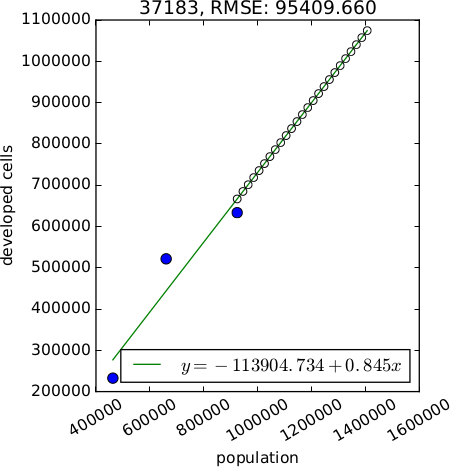
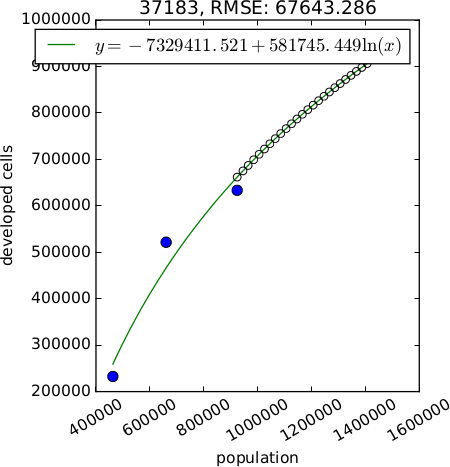
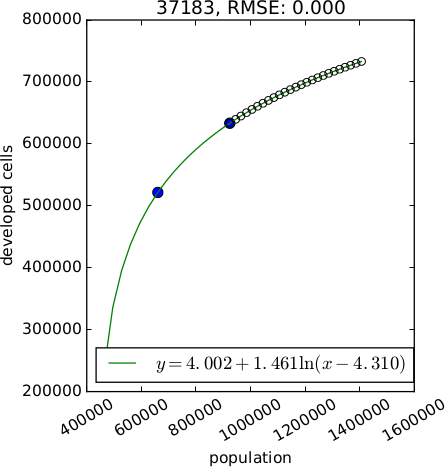
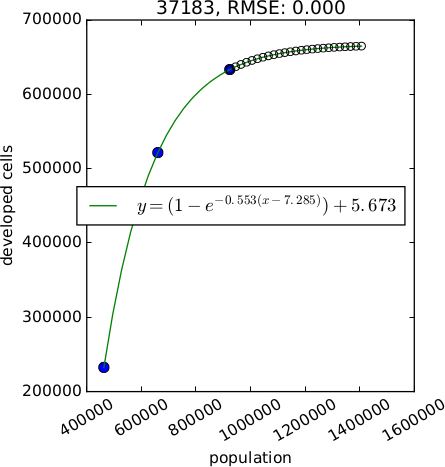
Figure: Example of different relations between population and developed area (generated with option plot). Starting from the left: exponential, linear, logarithmic with 2 unknown variables, logarithmic with 3 unknown variables, exponential approach
NOTES
r.futures.demand computes the relation between population and developed area using simple regression and in case of method exp_approach and logarithmic2 using scipy.optimize.curve_fit. It is possible to manually create a custom demand file where each column could be taken from a run with most suitable method.EXAMPLES
r.futures.demand development=urban_1992,urban_2001,urban_2011 subregions=counties \
observed_population=population_trend.csv projected_population=population_projection.csv \
simulation_times=`seq -s, 2011 2035` plot=plot_demand.pdf demand=demand.csv
REFERENCES
- Meentemeyer, R. K., Tang, W., Dorning, M. A., Vogler, J. B., Cunniffe, N. J., & Shoemaker, D. A. (2013). FUTURES: Multilevel Simulations of Emerging Urban-Rural Landscape Structure Using a Stochastic Patch-Growing Algorithm. Annals of the Association of American Geographers, 103(4), 785-807. DOI: 10.1080/00045608.2012.707591
- Dorning, M. A., Koch, J., Shoemaker, D. A., & Meentemeyer, R. K. (2015). Simulating urbanization scenarios reveals tradeoffs between conservation planning strategies. Landscape and Urban Planning, 136, 28-39. DOI: 10.1016/j.landurbplan.2014.11.011
- Petrasova, A., Petras, V., Van Berkel, D., Harmon, B. A., Mitasova, H., & Meentemeyer, R. K. (2016). Open Source Approach to Urban Growth Simulation. Int. Arch. Photogramm. Remote Sens. Spatial Inf. Sci., XLI-B7, 953-959. DOI: 10.5194/isprsarchives-XLI-B7-953-2016
- Sanchez, G.M., A. Petrasova, A., M.M. Skrip, E.L. Collins, M.A. Lawrimore, J.B. Vogler, A. Terando, J. Vukomanovic, H. Mitasova, and R.K. Meentemeyer (2023). Spatially interactive modeling of land change identifies location-specific adaptations most likely to lower future flood risk. Sci Rep 13, 18869. DOI: 10.1038/s41598-023-46195-9
SEE ALSO
FUTURES, r.futures.simulation, r.futures.parallelpga, r.futures.devpressure, r.futures.potential, r.futures.potsurface, r.futures.calib, r.futures.gridvalidation, r.futures.validation, r.sample.categoryAUTHORS
Corresponding author:
Anna Petrasova, akratoc ncsu edu,
Center for Geospatial Analytics, NCSU
Original standalone version:
Ross K. Meentemeyer,
Wenwu Tang,
Monica A. Dorning,
John B. Vogler,
Nik J. Cunniffe,
Douglas A. Shoemaker
(Department of Geography and Earth Sciences, UNC Charlotte)
Jennifer A. Koch
(Center for Geospatial Analytics, NCSU)
Port to GRASS and GRASS-specific additions:
Vaclav Petras,
NCSU GeoForAll
Development pressure, demand, calibration, validation, preprocessing tools and maintenance:
Anna Petrasova,
NCSU GeoForAll
Climate forcing submodel:
Anna Petrasova,
NCSU GeoForAll
Georgina Sanchez,
Center for Geospatial Analytics, NCSU
Zoning:
Margaret Lawrimore,
Center for Geospatial Analytics, NCSU
Anna Petrasova,
NCSU GeoForAll
SOURCE CODE
Available at: r.futures.demand source code (history)
Accessed: Sunday Sep 13 08:28:50 2026
Main index | Raster index | Topics index | Keywords index | Graphical index | Full index
© 2003-2026 GRASS Development Team, GRASS 8.5.1dev Reference Manual